Newton's method, Julia and Mandelbrot sets, and complex coloring
Martin
Pergler, 1999. Mildly revised in 2004
This page is a mildly annotated catalog of some cool images I've made when poking around with
visualization of complex functions by coloration
of the complex plane. It includes applications to iterated functions,
more specifically Newton's method, Julia sets, and the Mandelbrot set.
Both when I did it (1999) and now when I reread it and add a few lost images (2004), I'm persuaded that there
is something interesting in here--but now, just as then, I don't have time to figure it out. I'd love it if it
inspired someone to pursue it further and uncover whatever the magic is.
Some pages by others dealing with related topics (2004):
Hans Lundmark,
Frank Farris,
Francois Labelle, and
Tristan Needham
(additional links).
It seems the now accepted term for this sort of coloration is "domain coloring".
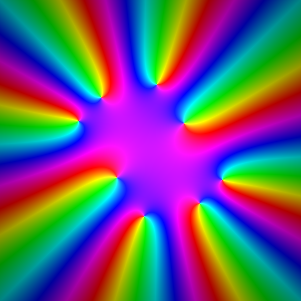
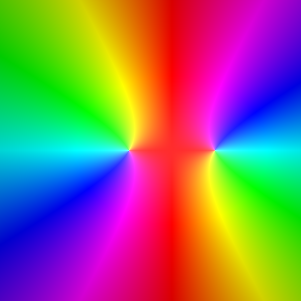
Coloration of the complex plane
The basic idea is that we color the complex plane with argument given by hue, modulus given by
luminosity, so that 0=white, infinite=black.
All diagrams on this web page cover the region from 2-2i to 2+2i.

For some applications we need to adjust the rate at which colors collapse
into black or white, so that the picture doesn't go all white or all black. For
this we use an adjustment factor. In the above picture, the adjustment
was 1.
adjustment=0.5
 |
adjustment=2
 |
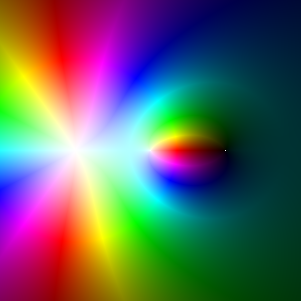
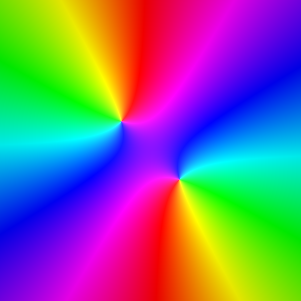
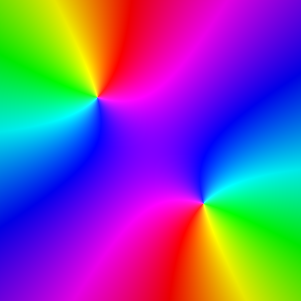
This coloring is particularly useful for showing roots and poles of
functions. One can see the multiplicity by counting the number of repeats
of the hue pattern around a point--see how the colors cycle once around 0, twice around -1, and once in the
reverse direction around +1.
Plot of (z+1)2z/(z-1). adjustment=0.65
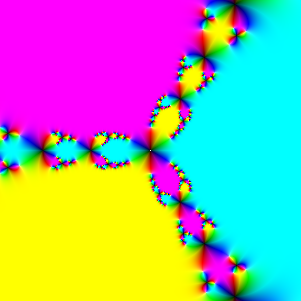
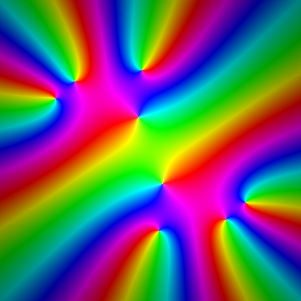
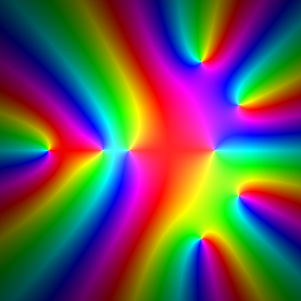
Exploration 1: Newton's method for z3-1.
f(z)=z3-1. adjustment=.65
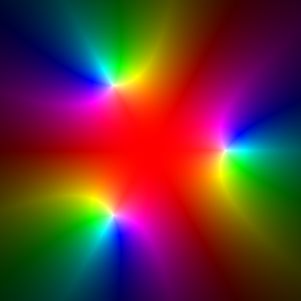
Here are iterations of the standard Newton mapping defined by this function
(see here or here
for more information of Newton mapping). They converge to
to the familiar Newton basin attractor diagram, but the coloured iterations
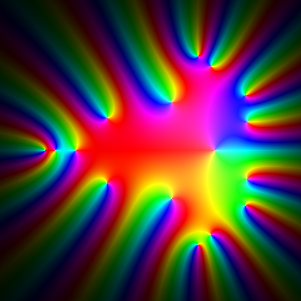
make it easy to see how the fractal self-similarity of the attractor arises. adjustment=0.4.
iteration 1
|
iteration 2
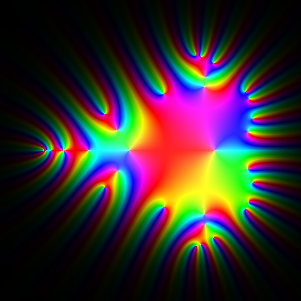
|
iteration 5
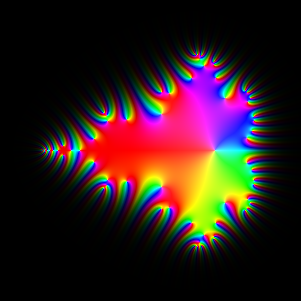
|
iteration 20
|
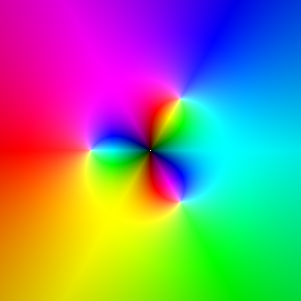
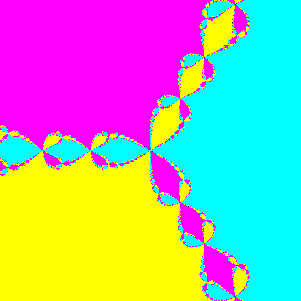
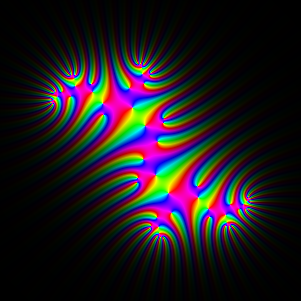
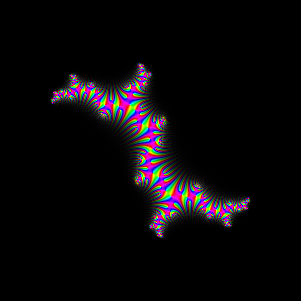
Exploration 2: Julia set of the iterated function g(z)=z2+0.3i.
Here are iterations of the above function g(z), leading to the Julia set attractor
(not Newton's method, straight iterations of the function). Once again, the coloring of the
1st iteration graphically describes the twist/turn self-similarity of the attractor. Since the constant 0.3i lies
in Mandelbrot set, the limiting Julia set is connected. adjustment=0.1.
iteration 1
|
iteration 3
|
iteration 6
|
iteration 9
|
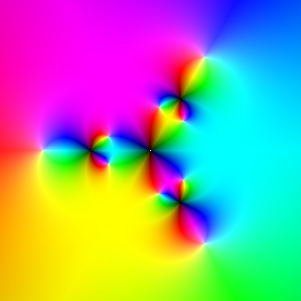
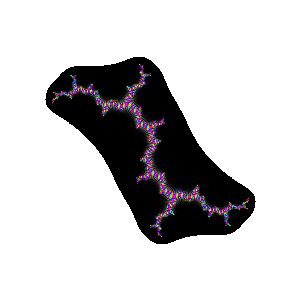
Exploration 3: Julia set for z2+i
Adjustment=0.1. The constant i is on the border of the Mandelbrot set,
so limiting Julia set is a curve (infinite tree).
iteration 1
|
iteration 3
|
iteration 6
|
iteration 9
|
iteration 12. (numeric loss of precision outside
black region--it should be black)
 |
|
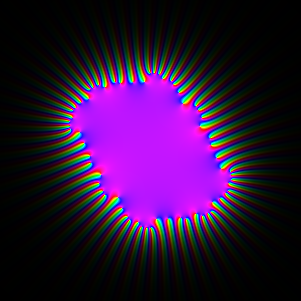
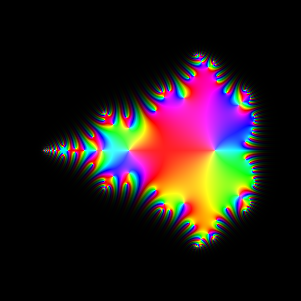
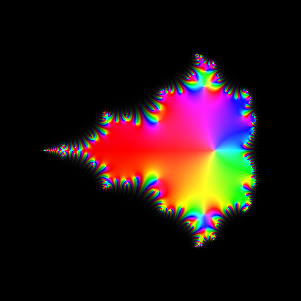
Exploration 4: Creating the Mandelbrot set
We now iterate the Mandelbrot mapping z -> z2+c, starting with z1=c, and plot
zn as a function of c. The Mandelbrot set consists of those c for which zn stays
bounded.
The first set of pictures, for n=2..9 and n=20, shows the twists and turns as the Mandelbrot set is created.
iteration 2

|
iteration 3
|
iteration 4
|
iteration 5
|
iteration 6
|
iteration 7
|
iteration 8
|
iteration 9
|
iteration 20 (white should be black, again)
|
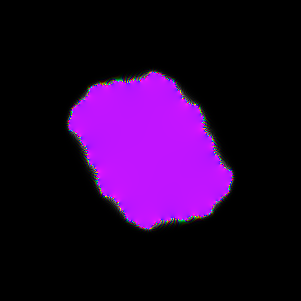
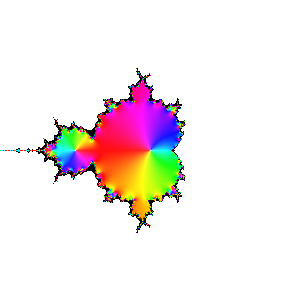
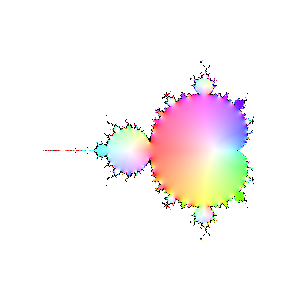
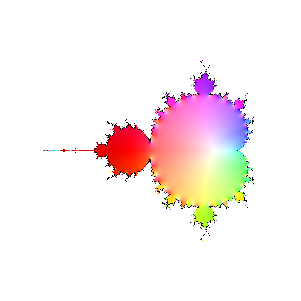
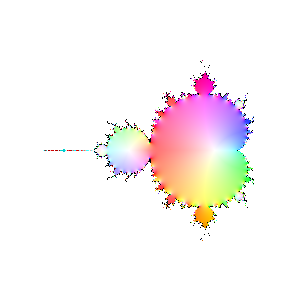
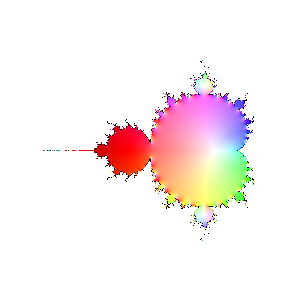
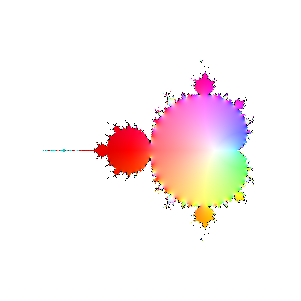
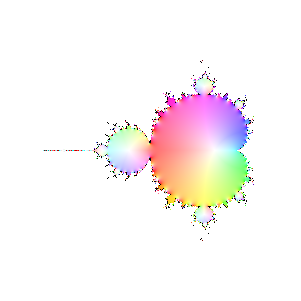
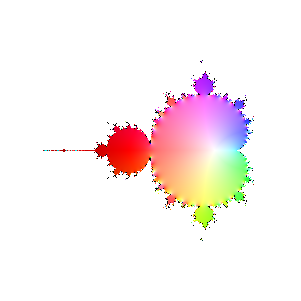
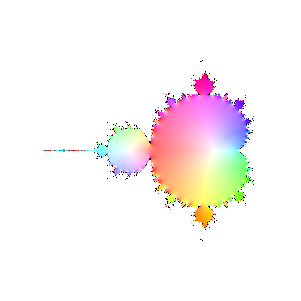
Finally, here are a bunch of iterations starting with n=30. The inside and outside of the Mandelbrot set
are firmly established (outside should be black, numeric loss of precision again). However, it's interesting
to see how the interior of the set sloshes around. The different bulbs have different periods, I think related to
their numbering in the proof of the connectedness of the Mandelbrot set, but I haven't looked it up.
iteration 30
|
iteration 31
|
iteration 32
|
iteration 33
|
iteration 34

|
iteration 35
|
iteration 36
|
iteration 37
|
iteration 38
|
MATLAB source files
Here are the Matlab source files I used to make these images back in 1999, if they're helpful to anyone.
Text and images copyright (c) 1999 and 2004, Martin
Pergler. Feel free to quote or adapt, with appropriate credit.