What is your Server's Real Uptime?
It's easy to claim "99.9% uptime", as so many web hosting services do. Just define it as
one piece of modern electronic equipment, the server itself, capable of running, even if
it isn't connected to the internet.
The practice isn't new. As early as the 1950's, when I first became involved with computers,
IBM defined their rental computers' uptime that way. For an entire day every month, the
computer was unavailable to its users because IBM was doing monthly maintenance. It was
still "up" according to IBM. Even though it took up to half an hour to "reIPL"
(IBM lingo for "restart") several times a day, the computer uptime clock was ticking the
whole time even though users were ticked off.
To a user, there is only one proper definition of "up": can I use it? Here's how
to estimate what that uptime is for viewers of your web pages.
It's based on access logs, maintained by your web page server so they know how much
they can charge you for bandwidth and hit costs. You normally have access to them via the
same FTP address you use for maintaining your site. They contain entries of the form
75.25.130.254 - - [01/Jan/2008:00:02:11 -0600] "GET /rvwinter.html HTTP/1.1" 200 24570 "-"
"Mozilla/4.0 (compatible; MSIE 7.0; Windows NT 5.1)"
 To determine uptime, it's the field in square [ ] brackets that's important. Convert
each to a time in seconds from the start of your logs, then analyse the
differences between successive times. Here's what I got from my server,
IX Web Hosting
over three years (1 March 2005-29 February 2008).
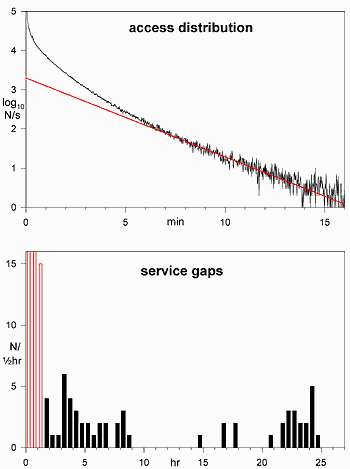
The top graph shows the short time scale. The red line on the log-linear plot marks an
exponential distribution, the hallmark of events randomly distributed in time. The
increase in rate below 5 minutes is due to non-random causes. Most of my pages
include images, which are requested as soon as a page is loaded. And, web accelerators
load pages refered to by the current page in advance whether they will be actually
viewed or not. The random portion
of the distribution (the slope of the red line) has an interval of 2.1 minutes,
while the overall mean interval is 16 s. So, each random
request results in an average of 7 additional non-random requests.
This random distribution must be subtracted from the time interval histogram to identify
service gaps. The second graph, based on a longer time scale, shows that it has reached
zero by 1.5 hours. The 0.5-1 slot is 494 events, the 1-1.5 slot 15, so the projected
contribution of the access distribution to the 1.5-2 hour slot is 0.03 The black
events of the lower graph, therefore, mark provable times when people were unable to
access my pages. My server may, of course, have been unavailable for shorter
periods in addition, but this method can't show them.
Total unavailable-to-viewers time: 664.4 hours over 36 months. Maximum possible
viewer up-time: 97.5%. That's the time during which everything necessary was working:
not just the host server, but the host routers and host internet access as well.
Of course, the server operator can measure their traffic flow second by second. But,
just as in the old days, I don't know of any service provider who makes this statistic
available to users. You have to do it yourself.
John Sankey
other notes on computing
 To determine uptime, it's the field in square [ ] brackets that's important. Convert
each to a time in seconds from the start of your logs, then analyse the
differences between successive times. Here's what I got from my server,
IX Web Hosting
over three years (1 March 2005-29 February 2008).