Plants respond very differently to light than humans do. The green curve shows the relative effectiveness of light in producing plant growth. The black curve shows a common definition of plant growth effectiveness used by the lighting industry - as you can see, it matches the needs of plants only a little better than lumens do.
Plants respond to wavelengths other than the green curve for non-growth functions such as flowering initiation, just as humans respond to wavelengths other than the red curve for non-visual needs, such as the production of Vitamin D. However, fresh-water aquarists mostly aim for plant growth.
What we aquatic plant growers need is a true plant-growth lumen (PGL). Here is how to calculate one.
First, obtain the spectrum of the lamp output (you'll have to get it from lighting engineers at the manufacturer; you won't find it on the package or in stores), and its lumen rating. If the spectrum is supplied in energy units such as watts (most are), you must convert it to a photon scale by multiplying each intensity by its wavelength.
Then, using the table below, multiply each spectral value of the lamp by the matching spectral factor for plants. For example, multiply the lamp intensity at 450 nm by 0.213 The result will be the spectrum of the lamp as a plant sees it. Add up all the numbers and call the result P (for Plant).
Next, multiply the lamp spectrum by the matching spectral factors for lumens. The result will be the spectrum of the lamp as a human sees it. Again, add up all the numbers, call it L (for Lumens).
Finally, multiply the lamp lumens by P and divide by L to get the PGL.
Here is an example: a 60 W incandescent lamp, whose output is shown in the black curve of graph 2 at right. The lamp output is 855 lm. Following the above procedure, the red curve is the way a human sees the light, the green, the way a plant sees it. The ratio of P to L is 1.26, so it produces 855 x 1.26 = 1077 PGL.
If the spectral data is not in 10 nm bands, or covers less range than 350-750 nm, this method will still work as long as the data is uniformly spaced over its range. Simply use the nearest values in the table below, the same ones for both P and L. Since the method only calculates a ratio between human and plant lumens, the units of lamp spectral intensity don't matter, as long as they are in photons, not energy.
The result of such analyses is clear: very few 'plant growth' or 'aquarium' lamps outperform cheap standard-spectrum fluorescent tubes or compact fluorescent lamps for growing aquarium plants.
Graph 3 at right shows why. Three lamps are shown, with their output in relative photons per second in 10 nm bands. The black curve is a standard warm-white tube, the others two different plant-growth lamps. The extended spectrum of most plant-growth lamps is obtained at the expense of total output. And, the tiny production volume of the specialist lamps compared to standard warm-white makes them much more expensive.
'White' Light-Emitting Diode (LED) lamps designed to replace incandescents are mostly based (2015) on a 460 nm blue LED combined with a yellow phosphor; a typical spectrum is shown as graph 4. Phosphors are still being developed for this role, and blue LEDs are under active development to improve efficiency at high power; also some manufacturers combine more than one LED type or add filter layers to improve the colour-rendering index. Expect rapid changes until the technology settles down.
The new COB-LED arrays change everything for specialist applications. Chips are available with native light spectra from near-UV to far-IR and are so small that many can be combined in one fixture to produce just about any desired spectrum. The longer the native wavelength, the higher the efficiency at high powers. Graph 5 is the spectrum of a commercial unit combining six different LEDs to optimize greenhouse seedling growth. There are units optimized for field-crop growth, flowering, fruit set, aquarium coral appearance, and just about any other spectrum one could wish. It all results in plant growth efficiencies far higher than any single-unit has ever produced. When this technology trickles down to lamp replacements, expect double today's 80 lm/W efficiencies. And, even better plant growth.
| type | model | watts | initial lumens | PGL | PGL/watt |
|---|---|---|---|---|---|
| straight filament incandescent | 15T10 | 15 | 120 | 172 | 11 |
| coiled filament incandescent | 60A19 | 60 | 855 | 1077 | 18 |
| halogen incandescent | PAR | 60 | 1050 | 1280 | 21 |
| warm-white fluorescent | 18" | 15 | 834 | 478 | 32 |
| warm-white fluorescent | 24" | 20 | 1253 | 718 | 36 |
| cool-white fluorescent | 24" | 20 | 1200 | 750 | 38 |
| warm-white fluorescent | 36" | 30 | 2123 | 1216 | 41 |
| 2700 K compact fluorescent | 20 | 1200 | 841 | 42 | |
| warm-white fluorescent | 48" | 40 | 3117 | 1785 | 45 |
| Hagen fluorescent | AquaGlo | 20 | 400 | 950 | 47 |
| Hagen fluorescent | SunGlo | 20 | 1230 | 988 | 49 |
| Hagen fluorescent | PowerGlo | 20 | 1100 | 1045 | 52 |
| special purpose lamps | |||||
| aquarium fluorescent | #1 | 20 | 750 | 707 | 35 |
| aquarium fluorescent | #2 | 20 | 950 | 740 | 37 |
| aquarium fluorescent | #3 | 20 | 875 | 690 | 34 |
| plant-grow fluorescent | #4 | 20 | 480 | 740 | 37 |
| plant-grow fluorescent | #5 | 20 | 750 | 560 | 28 |
| plant-grow fluorescent | #6 | 20 | 670 | 640 | 32 |
| metal-halide discharge | 50 | 3000 | 1890 | 38 | |
| high-pressure sodium | 35 | 2240 | 1534 | 44 | |
human, plant and 'quantum' sensitivity
incandescent lamp performance
plant-growth vs. warm-white
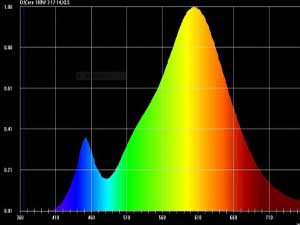
Cree 18W warm white
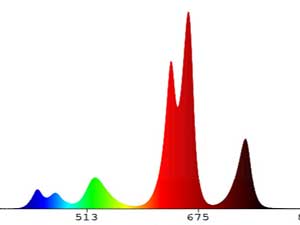
COB-LED assembly for seedlings