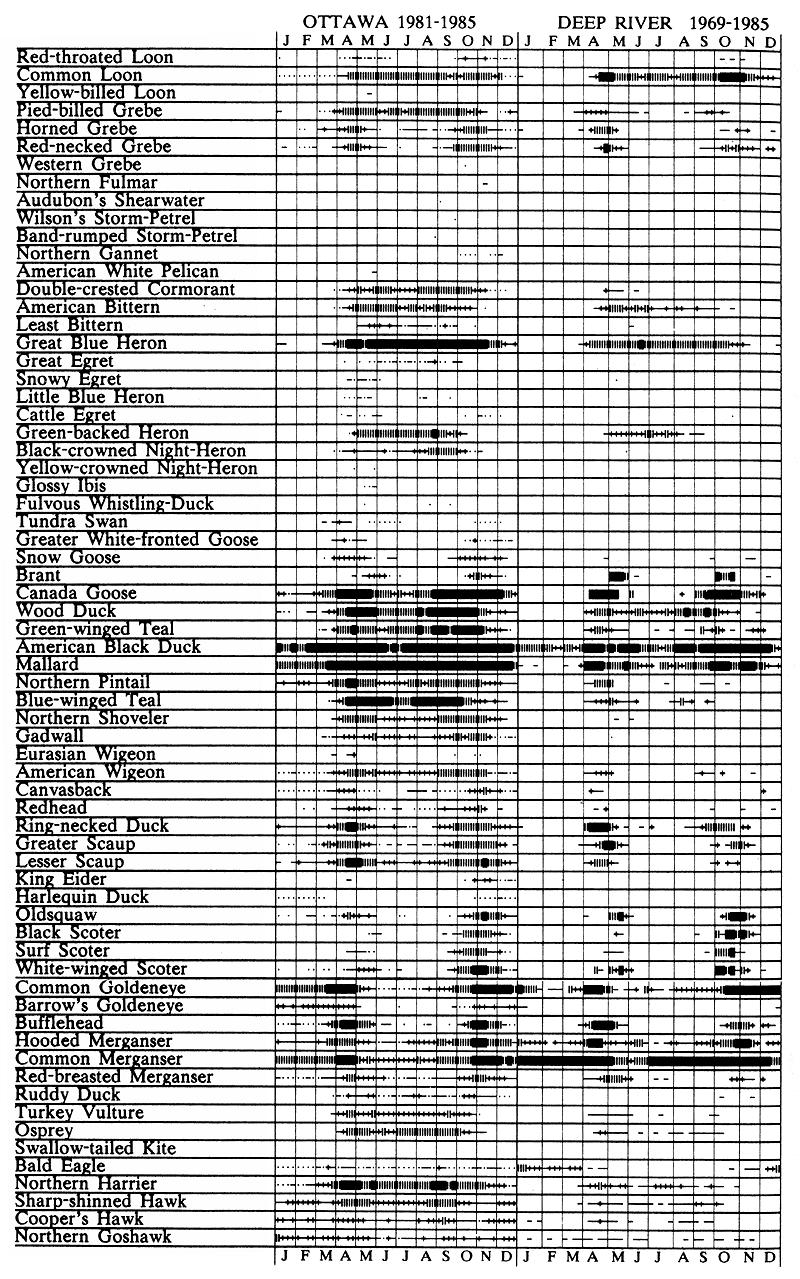
Anyone preparing to see birds wants to know how likely it is that each species will be seen, so that the best habitat for the period will be visited. Anyone observing a bird wants to know whether or not it is unusual. Here is a graph designed to show this, week by week. One, for a 50 km radius about Parliament Hill, Ottawa, predicts how many species you will see. The other, for a 3 km radius about Deep River, predicts how many birds you will see. This book is about all the various ways of relating to birds, so each is presented on its own terms.
The Ottawa graph was prepared from the 20,000 day records of all contributors to The Shrike, for the five years 1981-85 that I edited it. Historical sightings of rarities were added, as dots. About half of these records were from birders of average competence, the other half were from the best birders in the region. Each observer noted the number of each species seen each day, but not the time spent. Several times each month, one of the top birders would do a 'big day', covering all the hot spots, typically birding 10 hours in winter, 16 to even 20 hours in spring or fall. About four times as many species were seen on big days as on normal days, and the data is normalized to the big days. So, this graph tells you how likely it is for an experienced birder, familiar with the area, to see one or more of a species during a full day's birding.
The Deep River graph was prepared from 2000 day records of Bill Walker, for the 17 years 1969-85. He recorded the duration of each field trip, and presents his data in terms of the number of birds of each species seen per hour spent birding. Naturally, Bill is now a very experienced observer, and knows every nook and cranny of his region. So, this graph, too, shows what you can achieve as a birder, not how well you will do on your first visit.
The probabilities are grouped into five classes:
| symbol | definition | Ottawa Graph | Deep River Graph |
|---|---|---|---|
| solid | found easily | seen >70% of days | >1 bird per 2 hours |
| || | f. with some effort | 20-70% of days | 1 per 2-10 hours |
| + | f. with difficulty | 5-20% of days | 1 per 10-40 hours |
| - | f.with great difficulty | <5% of days | <1 per 40 hours |
| . | not to be expected | prior to 1981 | outside 3 km circle |
The Ottawa data is organized around a 48-week system. The last few days of each month are considered to be in the fourth week for that month. (Most Ottawa listers keep month lists.) The Deep River data uses a 52-week system.
There is a tremendous amount of information packed into these graphs. Here are some ways for you to use them.
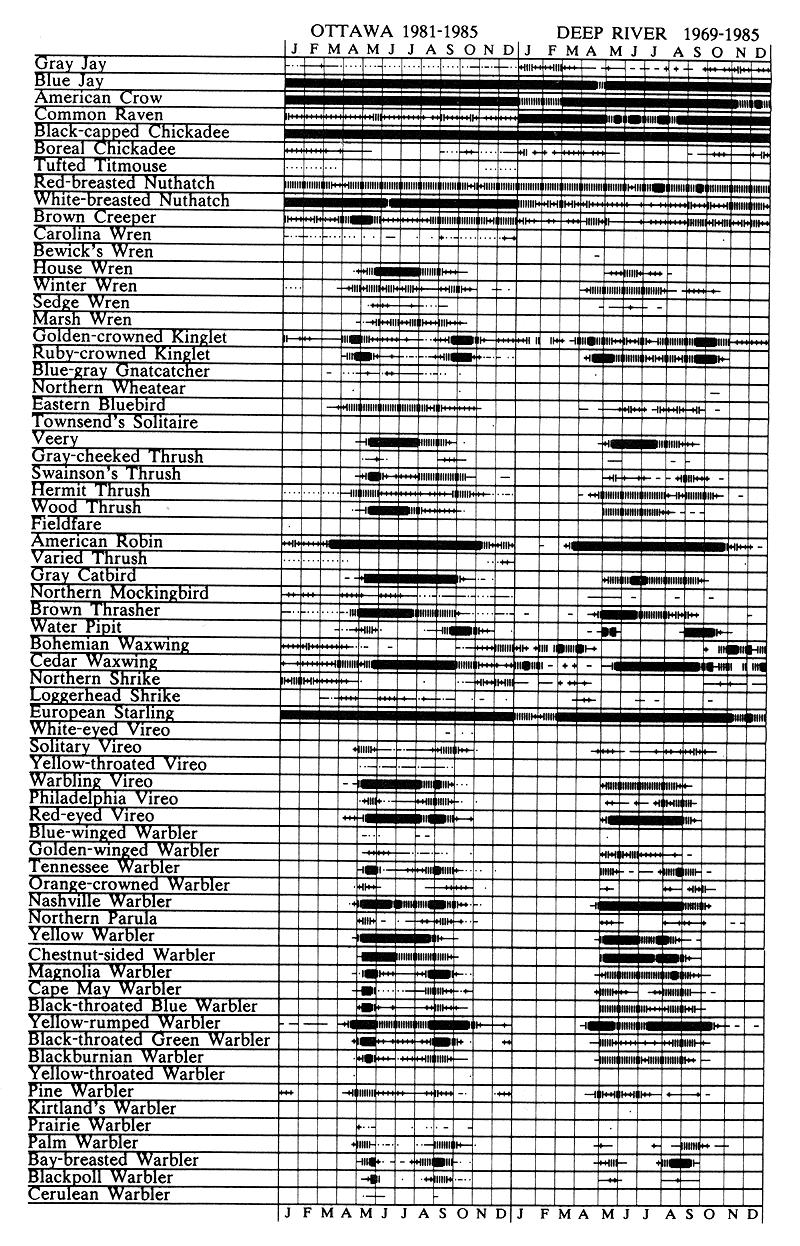
"When is the best time to find a wood thrush near Deep River?"
First, find the line for wood thrush. It shows nothing under
January, February, March or April, so Bill has never seen a wood
thrush during these months. However, under the 7th of May, it
shows the solid bar that means 'found easily', and this symbol
continues right over to the week starting the 23rd of July. May
7th to July 29th is therefore the best time for wood thrush.
"I saw a merganser near Manotick on February 1st, but I'm not
sure which one?"
The Ottawa chart shows 'found with some effort' (the effort
required to drive to Manotick, that is!) for common merganser
this week, and a much lower probability for both hooded and red-
breasted. Probably, you saw a common.
"If I go out birding around Ottawa on July 1st, how many
species might I see?"
Trace down the column under the first week of July, and count the
species showing 'found easily' (66), 'found with some effort'
(32), and 'found with difficulty' (42). Then, count 1 for each
'found easily', 0.5 for each 'found with some effort', and 0.1
for each 'found with difficulty'. The total is 86 species.
Remember, you must be an experienced birder, know the area, and
spend most of the day to reach this total. All observers for The
Shrike combined together logged an average of only 94 species on
July 1st over the period 1981-5.
A technical note. It is common when preparing such graphs to smooth out the data, to make it 'look good'. Birds are unpredictable. So is weather, so are birders. Variation, in short, is part of nature. With that philosophy in mind, these graphs present the real data, as it happened. The divisions between the first four classes are made so that each appears approximately an equal number of times, on each graph.
Red-throated Loon to Northern Goshawk
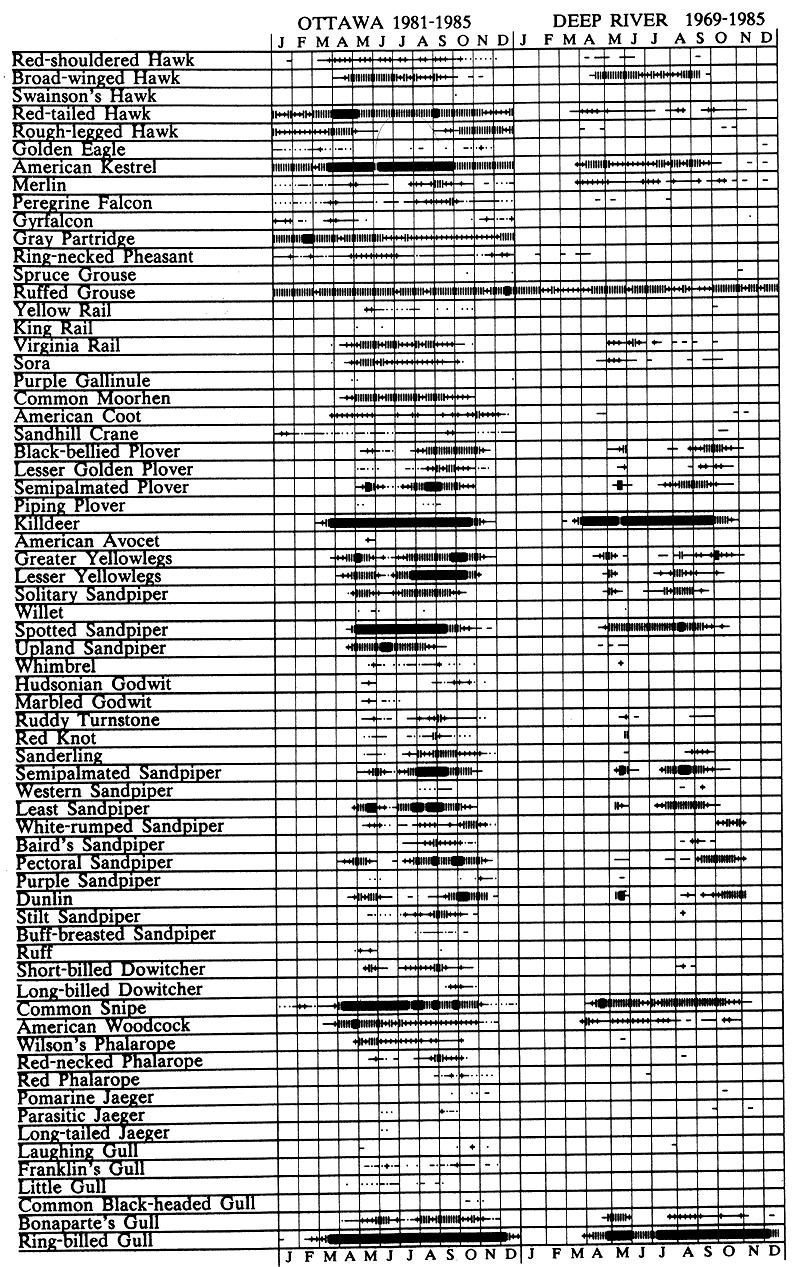
Red-shouldered Hawk to Ring-billed Gull
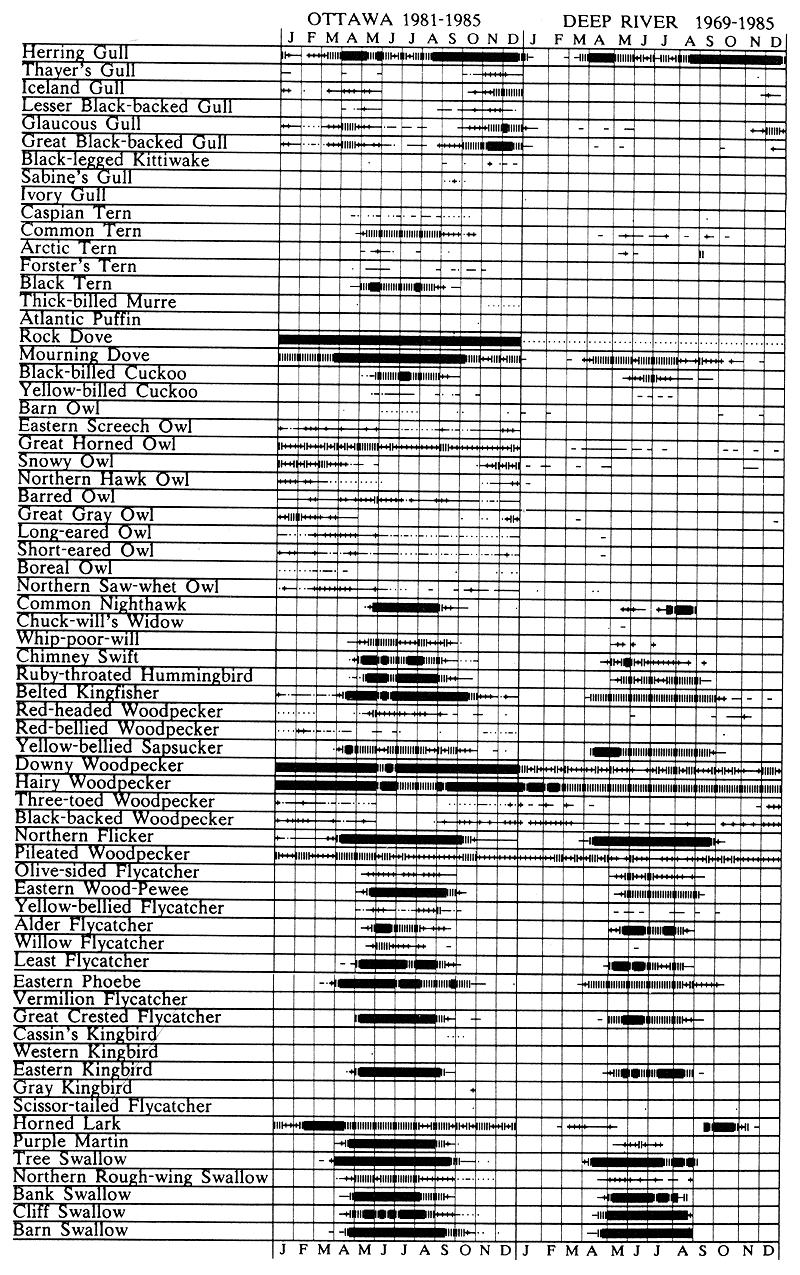
Herring Gull to Barn Swallow
Gray Jay to Cerulean Warbler
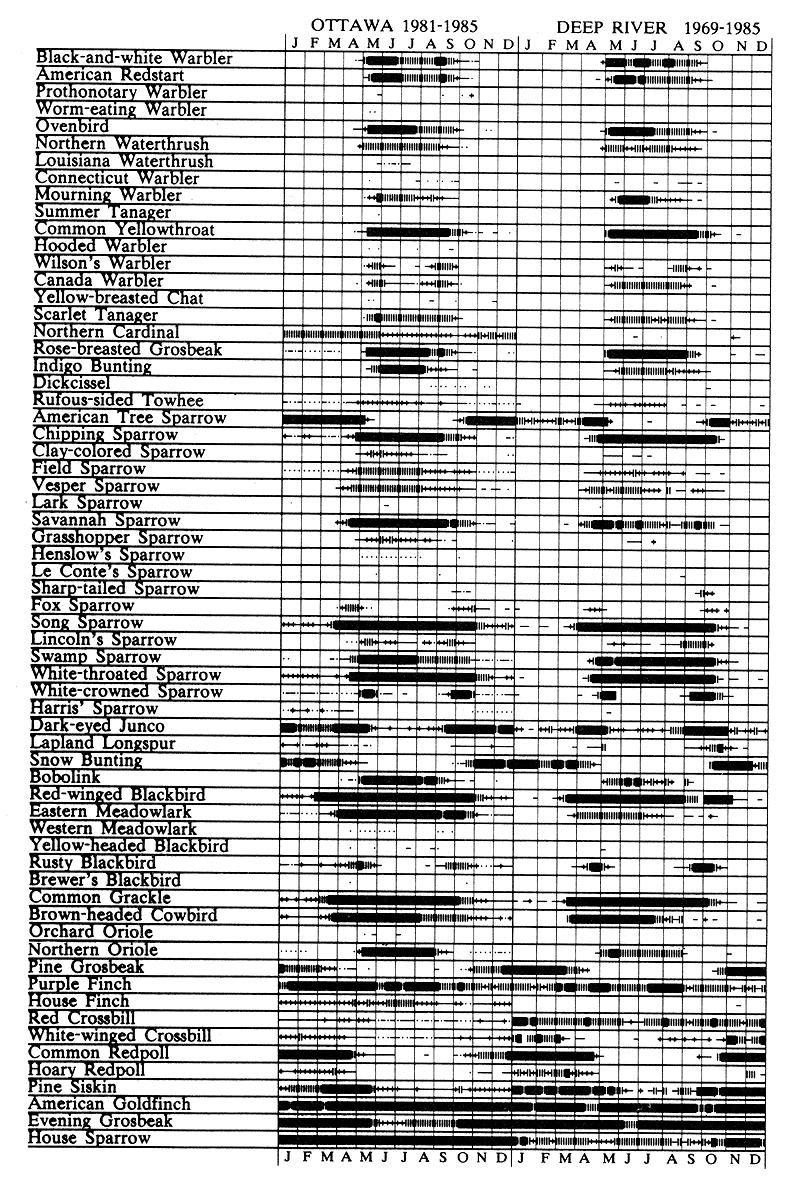
Black-and-white Warbler to House Sparrow