


650,000 years of CO2 and temperature history, from Antarctic ice cores. Dips record ice ages. CO2 concentration and temperature are related. CO2 has spiked upward in recent years.
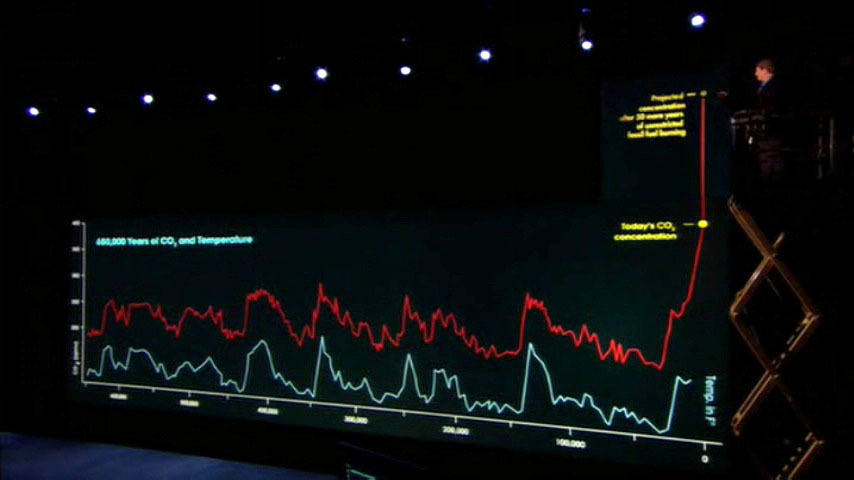
If no changes are made, CO2 concentration is predicted to climb much higher (to 600 ppm) in 45 years.
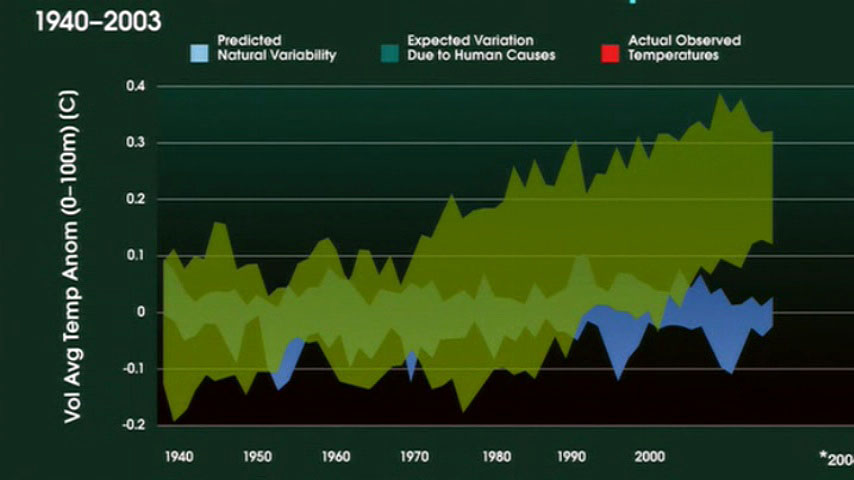
Ocean temperatures since 1940. Blue indicates normal range, green indicates range predicted by climate models due to human causes.

Ocean temperatures (see previous chart). Red line indicates actual ocean temperature history (outside and above normal range -- climate models were right).


Global precipitation has increased in last century by 20% but not evenly; some areas have received less. Sub-Sahara Africa is severely affected.


The 'Global Ocean Conveyor Belt' carries heat around the globe, in particular, to Europe. However, disruption due to ice melt has stopped heat flow to Europe in the past.

Global warming shifts the seasons, disrupting ecological relationships (here, the time of Black Tern bird arrival (blue) and bird hatching (yellow); hatching no longer coincides with insect peak (orange), starving chicks in Netherlands.

Antarctic ice shelf break-up predicted by models has occurred. Larsen ice shelf (green) broke up from 1995 to 2002. Sea levels are rising. A 20 ft (6m) rise in sea level would create over 100 million refugees.

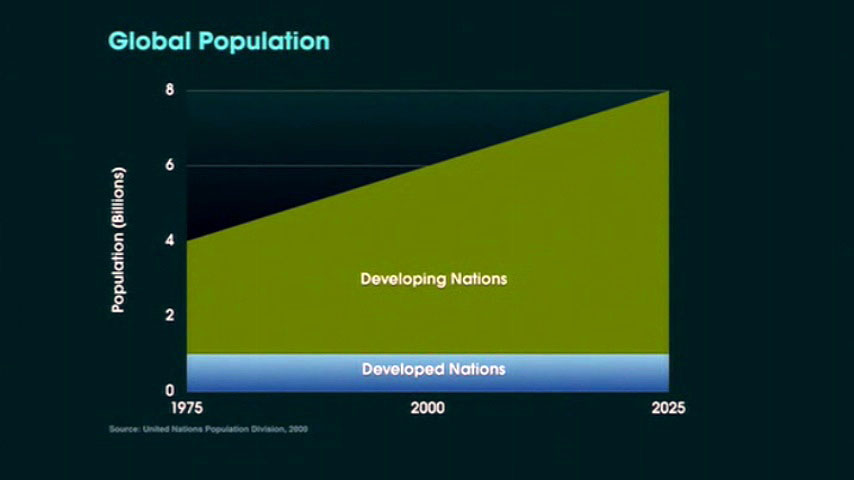
Population has exploded in the last 200 years. In 1945 there were 2.3 billion people, in 2006 there are 6.5 billion, and in 2050 there may be 9.1 billion.


Relative contribution to global warming, by country. "USA is responsible for more greenhouse gas pollution than South America, Africa, the Middle East, Australia, Japan, and Asia -- all put together."


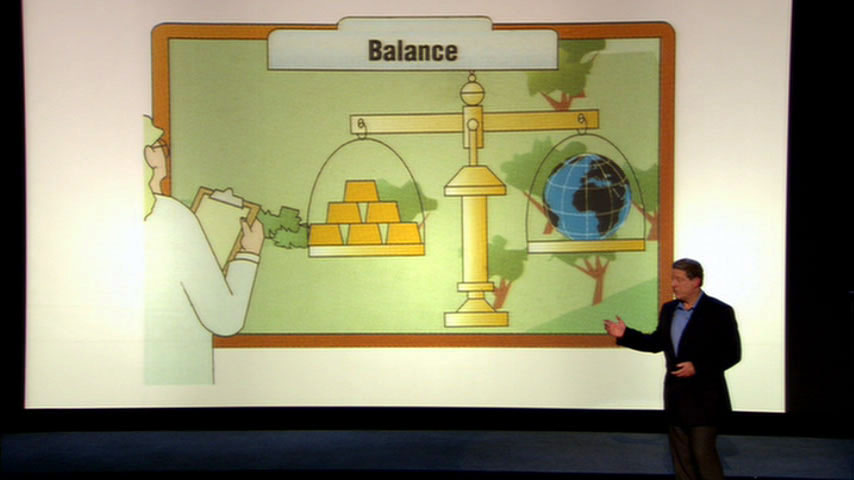
We don't have to choose between a healthy economy and a healthy environment. Without a planet, we won't enjoy gold bars, and if we do the right things, we'll have both.

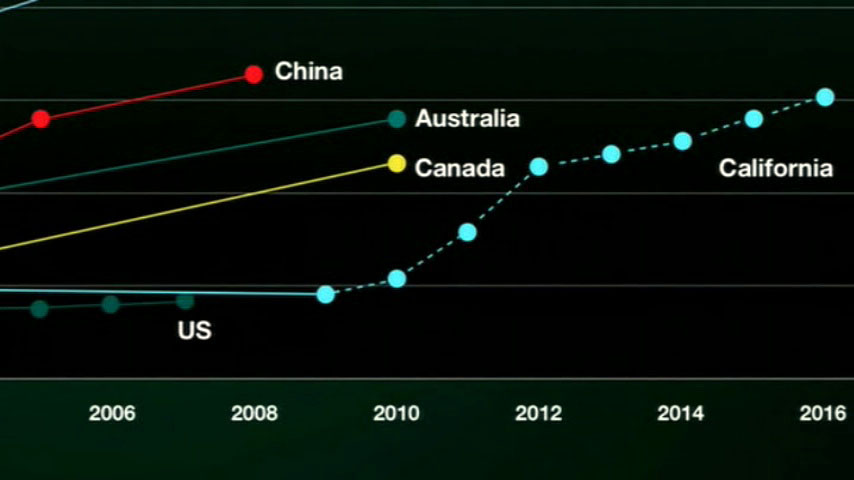
California proposes standards that exceed US national standards. US car manufacturers suing California, saying targets are unreachable in 10 years -- despite manufacturers in other countries already doing it now.

Companies building more efficient cars are doing well; US car manufacturers are losing market capitalization.


... More efficient use of electrical energy (blue), more efficient buildings (purple), improved vehicle efficiency (green), more efficient transport (light green), increased reliance on bio and wind energy (tan), CO2 sequestering (white).

"Future generations may well have occasion to ask themselves, What were our parents thinking? Why didn't they wake up when they had the chance? We have to hear that question, from them, now."