By spring 1999, 208 trees survived, of mean DBH 170 mm. The Crown Competition Factor (USDA Forest Service) was 2.6, very high. (1.0 is considered optimal for timber production, 0.5 or less for optimal nut production.) 10 had dead or badly broken tops, 10 were growing very weakly, 30 had other serious structural problems. All are excessively slender for their height. A patch of ground at the rear (Q5) seems to be toxic to trees - none survived in it and most of those surviving around it had obvious growth problems. A dozen trees were removed for a well (F2) in the early 90's. The mean crown height of the successful interior trees was about 10 m. Nut production has been low, and the nuts are almost entirely infertile. This is consistent with other CRF plantations where the source of stock is known - the CRF director had the notion that solely the "best" tree in a population must be the sole source of seed, so most plantations suffer from inbreeding.
The plantation restoration was planned to take place over 2000-2010 with about 10% thinning each year. This will enable the remaining trees to strengthen their trunks and roots sufficiently to withstand exposure to wind. For 2000, only the worst damaged and very weakly growing trees were removed. Some forked trees had the weakest fork removed to see how they recover. There were no nuts in 2001, so thinning was based solely upon crown competition.
There was a small crop of nuts in 2002. The best was 50 nuts per tree. In almost all cases, nut production was proportional to the light received by the canopy of the tree. Crown competition and nut production factors agreed for every tree removed fall 2002.
The trees did not respond as hoped to the vacant canopy left by the 2000-2 thinnings. The trees put on DBH, but their crown coverage did not increase significantly, so no thinning was done in 2003. By 2004, with 4 years of growth data in hand, the ten slowest-growing trees were removed, those with less than 1/3 the average growth rate of 7.1 mm/yr.
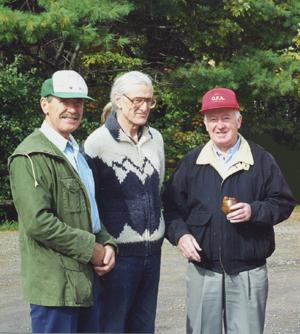
Presentation of a mug made from a tree culled from the grove to Moe Anderson, who helped to plant the grove in 1978.
 A map of the plantation in 2004. The brightest green indicates the largest DBH (355 mm), the darkest green the smallest
(116 mm). Black symbols show the trees removed during thinning: circle 2000, square 2001, point-up triangle 2002,
point-down triangle 2004. I thank Mike Rosen, the Ottawa-Carleton Stewardship Council coordinator, and his forestry
students for help in making the measurements in 2000.
A map of the plantation in 2004. The brightest green indicates the largest DBH (355 mm), the darkest green the smallest
(116 mm). Black symbols show the trees removed during thinning: circle 2000, square 2001, point-up triangle 2002,
point-down triangle 2004. I thank Mike Rosen, the Ottawa-Carleton Stewardship Council coordinator, and his forestry
students for help in making the measurements in 2000.
 A comparison of growth 2000:2004 compared with that since planting. Red shows a decrease in growth with time, green an
increase, black is neutral. The increase in crown competition with time has caused growth to slow for most trees, from an
average of 8.5 mm/yr over 1978-2002 to 7.1 over 2000-2004. The increase in growth rate north of the toxic area
is suspected to be due to the leaching into groundwater, or decomposition, of the as-yet unidentified toxin.
A comparison of growth 2000:2004 compared with that since planting. Red shows a decrease in growth with time, green an
increase, black is neutral. The increase in crown competition with time has caused growth to slow for most trees, from an
average of 8.5 mm/yr over 1978-2002 to 7.1 over 2000-2004. The increase in growth rate north of the toxic area
is suspected to be due to the leaching into groundwater, or decomposition, of the as-yet unidentified toxin.