By spring 1999, 334 trees survived, all with many dead branch stubs. Most dead branches stayed attached to their trunks for at least a decade before falling off, so there are numerous deep open knots and cavities. 18 were badly forked, the tops of 3 were broken by ice recently, and 12 had a DBH less than half the mean. A few years before, Gloucester Hydro had removed the entire row of trees adjacent to Anderson Road and it's small power line, leaving a raw open edge which was rapidly being colonised by buckthorn. White and Grey birch had initially colonised much of the plantation, but the red oak had successfully outstripped them and shaded them out. The mean crown height of the successful interior trees was about 14 m, the crown base 11.5 m, DBH 17 cm. The basal area averages 20 m2/ha. The timber productivity has averaged 8 m3/ha-year.
So, the first lesson from this plantation is: red oak plantations on flat farm land can be successful, but they require manual pruning of low branches every few years to produce quality timber.
Thinning 2000
Management of the Dolman ridge plantations has two objectives, to research and demonstrate useful aspects of growing nut trees, and to preserve biodiversity within a natural setting, with minimal overt management.
There are few examples of pure red oak plantations in this area, so it would be useful information to determine the growth response of these trees at various spacings for timber production. Most of the area about the ridge was farmland until the 1960's, so there are few areas there with high closed canopy woods. The red oaks are such an area, so it is a useful contribution to the biodiversity of the ridge to maintain this habitat. More wildlife species use acorns for food than any other tree food. Varying the spacings of the trees will increase the variety of this type of habitat available for wildlife species. So, a moderate thinning of the plantation with the aim of producing a variety of tree spacings has merit under both objectives.
The location of each tree was measured on an x-y grid, along with it's diameter at breast height (DBH). The effective growing area of a tree was estimated by obtaining the distance between the tree and it's nearest eight neighbours and dividing the distance between each tree pair. The average of the squares of these eight distances was then divided by 1.5. (This procedure is exact for a uniform square grid of trees.)
A desired (target) area mix was chosen to improve the variation of spacing: a triangular distribution beginning at 2 m2 and decreasing to zero at 15 m2 per tree as shown below. The trees that should be removed so as to best fit the target spacing with the removal of the fewest trees were then identified. The final selection of trees to remove was done with this ranking in hand, but also looking at the quality of growth of the selected trees. No tree of greater than the mean DBH was removed unless it had a serious structural flaw. 34 trees were removed in total. The result has been a significant increase in the number of trees with about 5 sq.m. of growing space.
All the material has been left on the forest floor to decompose into food for the survivors, and habitat for tree frogs and other neat creatures that make up a healthy forest. In one area, the branches have been piled up for a brush pile, in another logs have been piled up - each will increase the biodiversity of the forest biome. In fact, a yellowthroat was checking out the brush pile even before it was completed!
Among the 34 removed were 4 healthy trees of DBH between 15 and 17 cm. Growth ring measurements were done on these, and on one larger tree of which a core sample had been taken earlier in the year. As the graphs show, the growth of these trees does not yet show any sign of limitation by growing area, so major thinning is not yet required. In 20 years, the trees at the closest spacings should begin to show some slowing of growth.
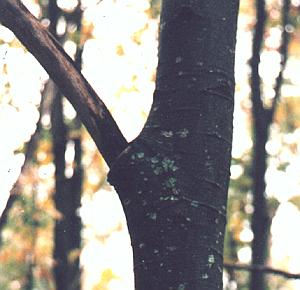
a typical dead stub as found
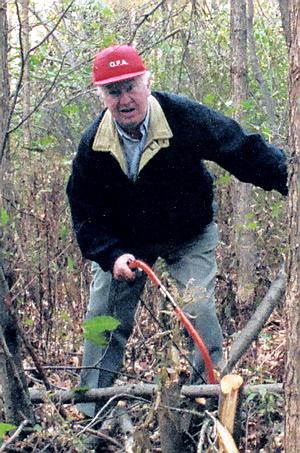
Moe Anderson clearing buckthorn, 1999
Mean growth of 5 trees of DBH close to the mean - steady
Correlation of DBH with growing area before thinning - none
Distribution of diameters (DBH, cm.) Red shows the trees removed during thinning 2000, black the
number of trees after thinning
Distribution of growing spaces. Green shows the increase as a result of thinning 2000, red the decrease.